Management Board of Northern Horizon Capital AS has approved the unaudited financial results of Baltic Horizon Fund (the Fund) for the three months of 2024.
Our strategic ambitions
Over the past year, our focus has been on reshaping our strategy to foster sustainable value, concentrating efforts on avenues that promise reliable and consistent growth for our investors. In light of prevailing market conditions, we firmly believe that the execution of the ‘Modern City Life’ strategy, introduced to investors in summer 2023, is paramount to their best interests.
In the coming years, we expect two thirds of the Fund’s NOI to come from centrally located multi-functional assets aligned with our ‘Modern City Life’ strategy. These spaces are meticulously designed to ignite, elevate and enrich the lives of modern citizens and communities. The remaining results are expected to be derived primarily from government-rented premises and select suburban supermarkets and other segments. Our value proposition hinges on quality, flexibility, sustainability, and remarkable service, underpinned by strategic locations tailored to meet the evolving needs of our clientele.
The Fund’s management team has made the strategic decision to implement key performance indicators (KPIs) as a means to effectively measure and track performance. This decision stems from the recognition that clear and measurable benchmarks are essential for evaluating progress towards the Fund’s objectives. By defining specific KPIs, the team aims to enhance transparency, accountability, and decision-making processes.
The focus of the Fund management team is and will be on these major objectives:
-
- Portfolio occupancy of at least 90% by end of 2024;
- Loan-to-Value target at 50% or lower and repayment of the bonds maturing in 2024;
- To consider disposing of non-strategic assets over the next 18 months;
- Clear ESG and refurbishment strategy for the next 1-2 years with an aim to reach the portfolio’s NOI potential of EUR 18 million by 2027.
- Maintaining 100% BREEAM or LEED certified portfolio.
- Achieving not less than 4 stars from GRESB assessment
Leasing performance
From a lowest occupancy point in September 2023, we embarked on a determined journey to revitalize the Fund’s leasing landscape and elevate the stature of its portfolio. We have navigated this path, signing approx. 40,000 sq. m. in lease prolongations and in new leases over the past six months, contributing to an increase of occupancy by 7,200 sq. m. This achievement signifies our ascent towards our strategic occupancy ambitions, as we strive to maintain our current clients as well as improve the leasing situation through new partnerships. This resurgence underscores our commitment to securing sustainable, long-term cash flow as we solidify our position as an active player in a challenging environment. These recent successes demonstrate the attractiveness of our properties entering the new real estate growth cycle with rental income gradually increasing over the coming quarters as the tenants move in.
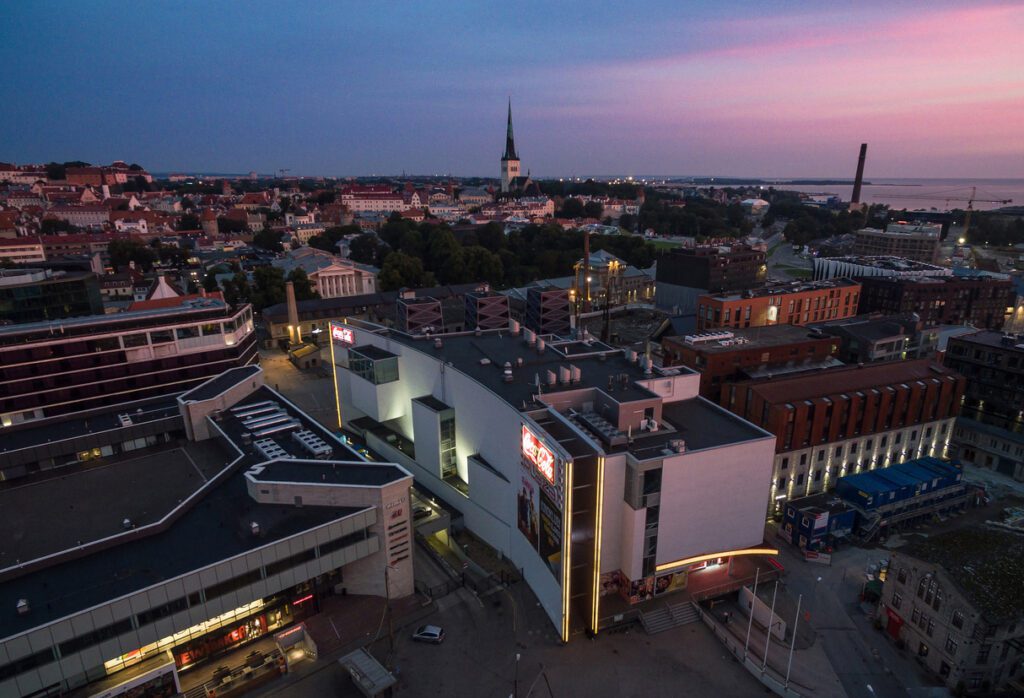
In April, the Fund finalized a significant new cooperation agreement with Apollo Group, the Baltics’ largest entertainment company, for approx. 2,200 sq. m on the 1st floor of Coca-Cola Plaza. With Apollo Group serving as the anchor tenant, this collaboration is poised to establish a dynamic urban lifestyle hub in the heart of Tallinn, offering a diverse range of entertainment, catering, and retail experiences. This 10-year lease agreement, complemented by extended cooperation agreements in the neighbouring Postimaja SC, strategically positions the property to optimize its NOI potential and foster seamless integration with the Rotermann area. The cinema facilities, located on the upper floors, will continue to operate on a long-term basis.
In a challenging market environment characterized by increasing real estate market vacancies across all Baltic states in recent periods, the Fund has demonstrated its adaptability by achieving a net inflow of leases in Q1 2024. This success was primarily attributable to significant deals with established entities in Europa and Meraki. During Q1 2024, the Fund signed new leases for 4,719 sq. m, securing an annual rental income of EUR 857 thousand for future periods. Furthermore, we are pleased to report that 9 new tenants have been attracted to our buildings, while 15 existing tenants have decided to continue their cooperation with us.
Outlook
Given the influence of recent economic and geopolitical events on the operational performance of certain assets and financing costs, Baltic Horizon units are now traded at a price that is more than 60% below NAV. This deviation is not aligned with our standards and is unacceptable to both our valued investors and to Northern Horizon as the Management Company.
To address this challenge, the Fund is strategically focused on enhancing the strength of our centrally-located retail portfolio throughout 2024. This involves the introduction of new anchor tenants and the implementation of further concept changes aimed at revitalizing and maximizing the potential of our retail assets. Concurrently, the Fund is proactively addressing vacancy concerns within office buildings by pursuing new collaborative agreements with governmental tenants, implementing flexible workspace solutions and being in close dialogue with conventional office tenants.
Simultaneously, the Fund remains committed to improving debt service and lowering leverage levels. These efforts are essential to fortifying our financial position and enhancing overall portfolio resilience in the face of ongoing market volatility and uncertainty. By executing these strategic initiatives, Baltic Horizon aims to mitigate the current deviation from the NAV.
In line with the Fund’s strategic goals, an additional EUR 4.5 million of bonds have been redeemed, advancing the reduction of the proportion of bonds within the debt structure. The Fund aims to fully refinance the outstanding EUR 8 million of the initial tranche with a more cost-effective financing option. Exploring refinancing options, the Fund is considering leveraging the Meraki asset, which has garnered increased interest from financial institutions following the successful leasing transactions with Narbutas and others.
The management team’s focus on maintaining a stable financial position remains a pivotal element of our long-term strategy. Through prudent financial management and a proactive leasing approach, we aspire to deliver sustainable performance and drive success for all those who place their trust in us.
Baltic Horizon achieves a 100% BREEAM certified portfolio
Successfully achieving BREEAM certification for all assets in our portfolio by the end of 2023 underlines our dedication to sustainability, and the introduction of green lease clauses in our agreements highlights our ongoing commitment to environmental responsibility.
GRESB benchmarking
In 2023 the Fund received a 4-star GRESB rating. The Fund scored 27 points (out of 30) in the Management module and 55 points (out of 70) in the Performance module.
Net result and net rental income
In Q1 2024, The Group recorded a net loss of EUR 624 thousand against a net profit of EUR 22 thousand for Q1 2023. The net result was strongly impacted by higher financial expenses and one-off transaction fees. Earnings per unit for Q1 2024 were negative at EUR 0.01 (Q1 2023: EUR 0.00).
The Group earned net rental income of EUR 2.8 million in Q1 2024 (Q1 2023: 4.2 million). The results for Q1 2023 include two months’ net rental income of the Domus Pro Retail and Office property (EUR 0.3 million) and the full-quarter net rental income of the Duetto properties (EUR 0.7 million), which were sold in February and May 2023, respectively.
On an EPRA like-for-like basis, the portfolio net rental income was 13% lower than in the same quarter of the previous year, mainly due to vacancies in office properties in Latvia due to the expiry of the agreement with the main tenant in Upmalas Biroji BC and EMERGN’s decision to reduce their rented area in S27, as well as lower rental income in Europa due to new anchor tenant IKI equipping the premises and opening in March.
Investment properties
At the end of Q1 2024, the Baltic Horizon Fund portfolio consisted of 12 cash flow generating investment properties in the Baltic capitals. The fair value of the Fund’s portfolio was EUR 251.3 million (31 December 2023: EUR 250.4 million) and incorporated a total net leasable area of 118.6 thousand sq. m. During Q1 2024 the Group invested approximately EUR 0.95 million in tenant fit-outs.
Gross Asset Value (GAV)
At the end of Q1 2024, the Fund’s GAV was EUR 268.3 million (31 December 2023: EUR 261.1 million), 3.1% higher than at the end of the previous period. The increase is mainly related to the new loans taken by Europa and North Star from Šiaulių bankas, which were mainly used for partial early repayment of short-term bonds.
Net Asset Value (NAV)
As of 31 March 2024, the Fund’s NAV was EUR 108.7 million (31 December 2023: EUR 109.5 million). Compared to the year-end 2023, the Fund’s NAV decreased by 0.7%. The operational performance result was offset by one-off EUR 0.3 million transaction costs and financial expenses. As of 31 March 2024 , IFRS NAV per unit amounted to EUR 0.9087 (31 December 2023: EUR 0.9156), while EPRA net tangible assets and EPRA net reinstatement value were EUR 0.9503 per unit (31 December 2023: EUR 0.9546). EPRA net disposal value was EUR 0.9056 per unit (31 December 2023: EUR 0.9122).
Interest-bearing loans and bonds
As of 31 March 2024 interest-bearing loans and bonds (excluding lease liabilities) were EUR 151.6 million (31 December 2023: EUR 143.5 million). Outstanding bank loans increased due to the additional loans taken by Europa and North Star, which were mainly used for partial early redemption of short-term bonds in the amount of EUR 4.5 million on 8 April 2024. Annual loan amortisation accounted for 1.5% of total debt outstanding.
In February 2024, the Fund successfully refinanced Europa and Northstar loans with Šiaulių bankas. Additionally, in April 2024, the Fund prolonged the bank loan of S27. As of 31 March 2024, the Fund’s consolidated cash and cash equivalents amounted to EUR 12.5 million (31 December 2023: EUR 6.2 million).
Cash flow
Cash inflow from core operating activities in Q1 2024 amounted to EUR 1.8 million (Q1 2023: cash inflow of EUR 2.9 million). Cash outflow from investing activities was EUR 1.3 million (Q1 2023: cash inflow of EUR 7.7 million) due to investments in existing properties and transaction costs. Cash inflow from financing activities was EUR 5.8 million (Q1 2023: cash outflow of EUR 8.5 million). In Q1 2024, the Fund received additional loans in Europa and Northstar in the amount of EUR 8.6 million, and paid regular amortisation and interest on bank loans and bonds.
Key earnings figures
| EUR ‘000 | 2024 Q1 | 2023 Q1 | Change (%) |
| Net rental income | 2,794 | 4,202 | (33.5%) |
| Administrative expenses | (585) | (736) | (20.5%) |
| Other operating income (expenses) | 10 | 10 | – |
| Losses on disposal of investment properties | (367) | (1,533) | (76.1%) |
| Valuation losses on investment properties | (4) | (4) | – |
| Operating (loss) profit | 1,848 | 1,939 | (4.7%) |
| Net financial expenses | (2,497) | (2,037) | 22.6% |
| (Loss) profit before tax | (649) | (98) | 562.2% |
| Income tax | 25 | 120 | (79.2%) |
| Net (loss) profit for the period | (624) | 22 | (2,936.4%) |
| Weighted average number of units outstanding (units) | 119,635,429 | 119,635,429 | – |
| Earnings per unit (EUR) | (0.01) | 0.00 | – |
Key financial position figures
| EUR ‘000 | 31.03.2024 | 31.12.2023 | Change (%) |
| Investment properties in use | 251,331 | 250,385 | 0.4% |
| Gross asset value (GAV) | 268,273 | 261,138 | 2.7% |
| Interest-bearing loans and bonds | 151,617 | 143,487 | 5.7% |
| Total liabilities | 159,557 | 151,606 | 5.2% |
| IFRS Net asset value (IFRS NAV) | 108,716 | 109,532 | (0.7%) |
| EPRA Net Reinstatement Value (EPRA NRV) | 113,684 | 114,205 | (0.5%) |
| Number of units outstanding (units) | 119,635,429 | 119,635,429 | – |
| IFRS Net asset value (IFRS NAV) per unit (EUR) | 0.9087 | 0.9156 | (0.7%) |
| EPRA Net Reinstatement Value (EPRA NRV) per unit (EUR) | 0.9503 | 0.9546 | (0.5%) |
| Loan-to-Value ratio (%) | 60.3% | 57.3% | – |
| Average effective interest rate (%) | 5.8% | 5.2% | – |
During Q1 2024, the average actual occupancy of the portfolio was 81.6% (Q4 2023: 78.4%). The occupancy rate increased to 83.5% as of 31 March 2024 (31 December 2023: 81.1%). This overall occupancy rate increase was notably driven by significant uptake in Meraki and Postimaja. Additionally, new lease agreements were signed for Upmalas Biroji and Europa SC assets, while lease prolongations were executed across the majority of the portfolio’s assets.
Overview of the Fund’s investment properties as of 31 March 2024
| Property name | Sector | Fair value1 | NLA | Direct property yield | Net initial yield | Occupancy rate |
| (EUR ‘000) | (sq. m) | 20242 | 20243 | |||
| Vilnius, Lithuania | ||||||
| Europa SC | Retail | 36,740 | 17,047 | 2.6% | 3.0% | 84.2% |
| North Star | Office | 20,056 | 10,631 | 7.3% | 7.8% | 99.7% |
| Meraki | Office | 16,419 | 8,224 | 0.9% | 1.1% | 90.2% |
| Total Vilnius | 73,215 | 35,902 | 3.4% | 3.9% | 90.7% | |
| Riga, Latvia | ||||||
| Upmalas Biroji BC | Office | 20,482 | 11,212 | 3.6% | 3.9% | 58.8% |
| Vainodes I | Office | 16,710 | 8,128 | 6.4% | 8.3% | 100.0% |
| LNK Centre | Office | 13,960 | 7,450 | 1.7% | 2.1% | 42.8% |
| Sky SC | Retail | 5,660 | 3,259 | 7.8% | 7.1% | 100.0% |
| Galerija Centrs | Retail | 64,594 | 19,361 | 2.2% | 2.7% | 79.5% |
| Total Riga | 121,406 | 49,410 | 3.2% | 3.8% | 74.0% | |
| Tallinn, Estonia | ||||||
| Postimaja & CC Plaza complex | Retail | 20,338 | 9,232 | 3.4% | 6.2% | 100.0% |
| Postimaja & CC Plaza complex | Leisure | 13,242 | 7,914 | 5.0% | 4.5% | 81.1% |
| Lincona | Office | 14,370 | 10,767 | 6.2% | 7.0% | 83.6% |
| Pirita SC | Retail | 8,760 | 5,425 | 6.5% | 9.3% | 97.1% |
| Total Tallinn | 56,710 | 33,338 | 4.8% | 6.5% | 89.8% | |
| Total portfolio | 251,331 | 118,650 | 3.6% | 4.5% | 83.5% |
- Based on the latest valuation as of 31 December 2023, recognised right-of-use assets and subsequent capital expenditure.
- Direct property yield (DPY) is calculated by dividing annualized NOI by the acquisition value and subsequent capital expenditure of the property.
- The net initial yield (NIY) is calculated by dividing annualized NOI by the market value of the property.
CONSOLIDATED STATEMENT OF PROFIT OR LOSS AND OTHER COMPREHENSIVE INCOME
| EUR ‘000 | |||
| 01.01.2024 – 31.03.2024 |
01.01.2023 – 31.03.2023 |
||
| Rental income | 3,846 | 5,274 | |
| Service charge income | 1,048 | 1,442 | |
| Cost of rental activities | (2,100) | (2,514) | |
| Net rental income | 2,794 | 4,202 | |
| Administrative expenses | (585) | (736) | |
| Losses on disposal of investment properties | (367) | (1,533) | |
| Other operating income | 10 | 10 | |
| Valuation losses on investment properties | (4) | (4) | |
| Operating profit (loss) | 1,848 | 1,939 | |
| Financial income | 4 | – | |
| Financial expenses | (2,501) | (2,037) | |
| Net financial expenses | (2,497) | (2,037) | |
| Profit (loss) before tax | (649) | (98) | |
| Income tax charge | 25 | 120 | |
| Profit (loss) for the period | (624) | 22 | |
| Other comprehensive income that is or may be reclassified to profit or loss in subsequent periods | |||
| Net gain (loss) on cash flow hedges | (219) | (251) | |
| Income tax relating to net gain (loss) on cash flow hedges | 27 | 41 | |
| Other comprehensive income (expense), net of tax, that is or may be reclassified to profit or loss in subsequent periods | (192) | (210) | |
| Total comprehensive income (expense) for the period, net of tax | (816) | (188) | |
| Basic and diluted earnings per unit (EUR) | (0.01) | 0.00 | |
CONSOLIDATED STATEMENT OF FINANCIAL POSITION
| EUR ‘000 | 31.03.2024 | 31.12.2023 | |
| Non-current assets | |||
| Investment properties | 251,331 | 250,385 | |
| Intangible assets | 11 | 11 | |
| Property, plant and equipment | 6 | 4 | |
| Derivative financial instruments | 253 | 295 | |
| Other non-current assets | 534 | 647 | |
| Total non-current assets | 252,135 | 251,342 | |
| Current assets | |||
| Trade and other receivables | 2,716 | 2,591 | |
| Prepayments | 588 | 402 | |
| Derivative financial instruments | 375 | 621 | |
| Cash and cash equivalents | 12,459 | 6,182 | |
| Total current assets | 16,138 | 9,796 | |
| Total assets | 268,273 | 261,138 | |
| Equity | |||
| Paid in capital | 145,200 | 145,200 | |
| Cash flow hedge reserve | 339 | 531 | |
| Retained earnings | (36,823) | (36,199) | |
| Total equity | 108,716 | 109,532 | |
| Non-current liabilities | |||
| Interest-bearing loans and borrowings | 89,936 | 64,158 | |
| Deferred tax liabilities | 2,712 | 2,774 | |
| Other non-current liabilities | 1,135 | 1,079 | |
| Total non-current liabilities | 93,783 | 68,011 | |
| Current liabilities | |||
| Interest-bearing loans and borrowings | 61,932 | 79,584 | |
| Trade and other payables | 3,413 | 3,343 | |
| Income tax payable | – | 6 | |
| Other current liabilities | 429 | 662 | |
| Total current liabilities | 65,774 | 83,595 | |
| Total liabilities | 159,557 | 151,606 | |
| Total equity and liabilities | 268,273 | 261,138 |
For more information, please contact:
Tarmo Karotam
Baltic Horizon Fund manager
E-mail tarmo.karotam@nh-cap.com
www.baltichorizon.com
The Fund is a registered contractual public closed-end real estate fund that is managed by Alternative Investment Fund Manager license holder Northern Horizon Capital AS. Both the Fund and the Management Company are supervised by the Estonian Financial Supervision Authority.
To receive Nasdaq announcements and news from Baltic Horizon Fund about its projects, plans and more, register on www.baltichorizon.com. You can also follow Baltic Horizon Fund on www.baltichorizon.com and on LinkedIn, Facebook, X and YouTube.
This announcement contains information that the Management Company is obliged to disclose pursuant to the EU Market Abuse Regulation. The information was submitted for publication, through the agency of the above distributors, at 23:55 EET on 09 May 2024.
Attachment

